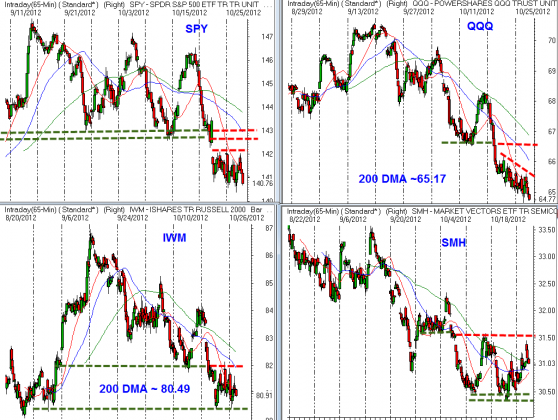
With the $QQQ and $IWM right near their 200 day moving averages for the first time since June, it “seems like” the market should bounce.
“Seems like” is not an objective technical measure. we need to look at price action on the shorter term timeframes for evidence that sellers are losing conviction and that buyers are stepping to at least provide a stable level of support to rally from.
Unfortunately, markets (exception of battered $SMH) are still below declining 5 day moving averages (which makes them guilty until proven innocent) and buyers are not stepping up with any confidence which continues to leave the market suspect.
$SPY IF a the market holds above last weeks low then we will have a higher low, but 142 has proven to be tough resistance and the upside appears limited with the prior level of support of 143-14350 likely to act as resistance on any upside attempt.
$QQQ testing the 200 day MA (not shown) but the pattern remains lower highs and lower lows below intermediate term moving averages. There is no evidence of any reason to buy.
$IWM 82 was a big level of support to break on the daily chart and this market will have to reclaim that level before we can attempt any rally atttempts.
$SMH is showing signs of attempte stabilization over the last week, but the primary trend is still lower and near term 3150 is the level likely to act as resistance.
Bottom line is the markets remain in intermediate term downtrends and until that changes all the “potential” support areas are just levels to watch, not a place to take action until the short to intermediate term timeframes give us signs of a turn.
click the chart to enlarge


