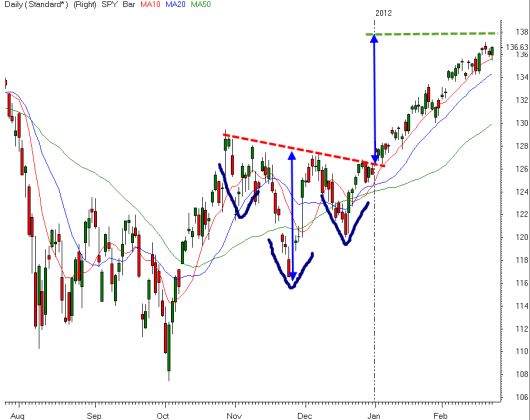
We have been tracking the inverted head and shoulders pattern on the $SPY since December of last year as the right shoulder was forming. The two arrows on the chart below are the exact same height. They represent the height of the inverted head and shoulders pattern and the projected upside target from the break of the neckline.
When the neckline was broken I cautioned that we couldn’t expect the upward target near 138 to be met without any significant pullbacks along the way. The target has not yet been hit, but I was wrong about significant pullbacks as the SPY has not experienced a down 1% day once this year. The chart in the POST BELOW takes a look at the steady uptrend the market has been in. Will the market it make it to the 138 level? Seems like it, but our job is to manage risk, focus on that.


