
Widely Recognized & Trusted By


Maximum Trading Gains
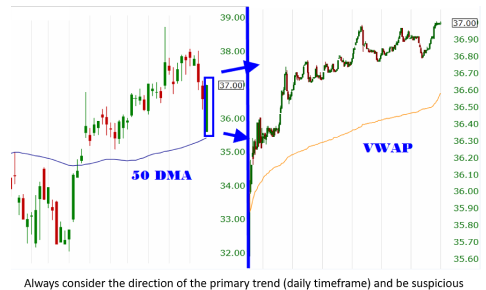
with Anchored VWAP
The Perfect Combination of Price, Time & Volume
By Brian Shannon
- Learn how to use the most powerful trading analysis tool to benefit your trading success.
- Brian Shannon is a stock market analyst and trader professional with over three decades of experience. He is an internationally recognized technical analysis expert, focusing on shorter-term timeframes. He has taught tens of thousands of traders to become better traders with his highly acclaimed book, Technical Analysis Using Multiple Timeframes
- He developed and applied the little-known Anchored VWAP (AVWAP) theory to his daily trading in the early 2000s and has found the AVWAP to be the most powerful analysis tool that improved his trading.
- He has been instrumental in getting the AVWAP tool on nearly a dozen charting platforms
- Brian published his newest seminal book, Maximum Trading Gains with Anchored VWAP: The Perfect Combination of Price, Time & Volume, in January 2023. It is the #1 Investment Analysis & Strategy book on Amazon and continues to sell out

Meet Our World Class
Trader and Educator With
Over 30 Years Of Market
Experience
Trade With Confidence & Learn From a
Swing Trading Expert
Brian Shannon, CMT is an American author and technical analyst. Shannon published his acclaimed book, “Technical Analysis Using Multiple Timeframes” in 2008 to educate beginning and intermediate swing traders on the tools and techniques that have made him “one of the best indie traders in the business.”

Stock Trading Courses - Learn Brian's Process
How would you like to learn the methods of professional traders so you can experience more
consistent market results regardless of market conditions?
I want to start with the Basics.
- New to trading? This is where to start!
- Over 3 hours of recorded video to view and review at your own pace.
- Learn the basics of market mechanics so you don’t make easily avoidable beginner mistakes.
- Learn what it takes to succeed at trading.
- Apply the Introduction to Trading Course cost ($99) to purchase our Advanced Stock Trading Course.
- Keep the Introduction to Stock Trading Course in perpetuity to review in the future.
I want to Advance my trading.
- More of an Intermediate to Advanced Trader?
- Over 9 hours of recorded video to view and review at your own pace, and yours to access in perpetuity.
- One-month PREMIUM Yearly Membership included, to implement your trading education and knowledge. You will sign-up for this at the completion of the Course.
- Special pricing on our PREMIUM Yearly Subscription: $800/year vs. $1299/year (current pricing). Offered after Course purchase.
- 30-minute 1-on-1 virtual meeting with Brian Shannon, to answer your questions.
Join Over 3,000 Winning & Active Traders
Results speak louder than words!
JP Daly City
CA
Steve Gomez
Alphatrends Subscriber
Russ Jaeger
Alphatrends Member
Nilo papachristou
Alphatrends Subscriber
JP
Alphatrends Subscriber
Arthur Kosirog
Alphatrends Subscriber

Howard Lindzon
Founder, StockTwits

Ryan Purtell
Alphatrends Subscriber

Kira Brecht
Market Analyst and Editor at TraderPlanet

Brian Lund
Co-Founder and EVP of Ditto Holdings, parent company of Ditto Trade and Followable
View Past End-of-Day Stock Market Update Videos


Latest Twitter Post
Due to new policies instituted by Twitter, you must be logged into twitter to view Brian’s tweets
Sign-up to Connect. Learn. Trade.
- Mid- & End-of-Week Market Analysis Videos
- Swing Trading Guides
- Market Stages Chart


We never share your information.
Signup To Get Free Friday Swing Trade Stock Market Analysis and 2 Free Swing Trading Guides